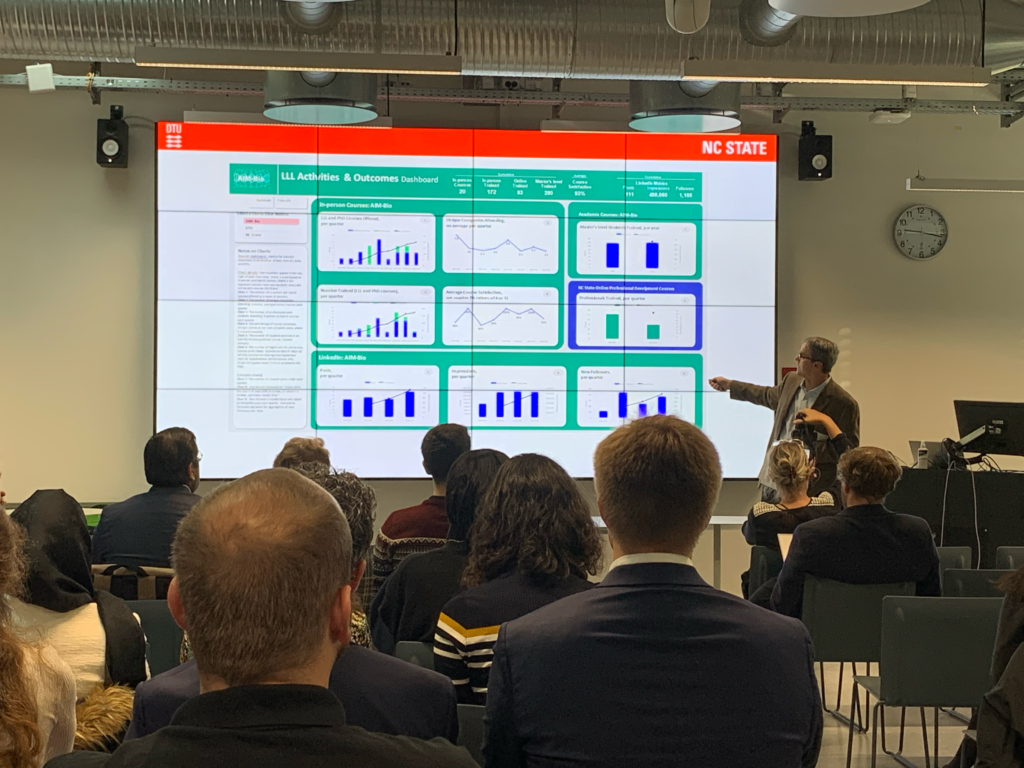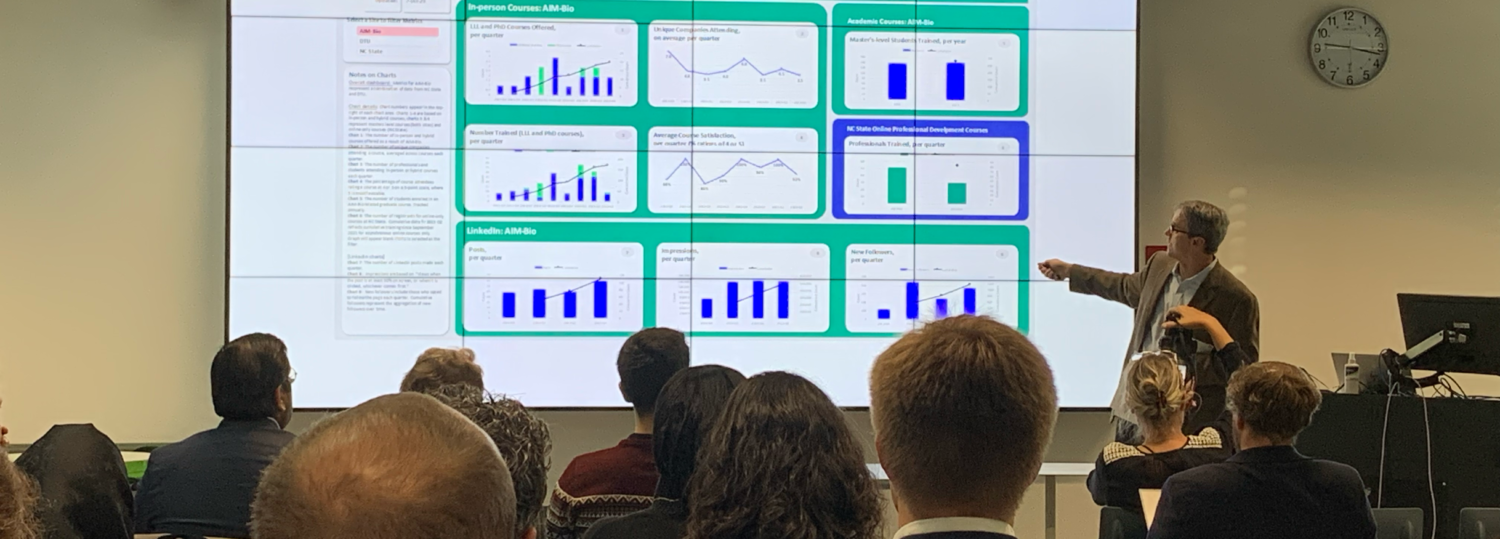
As the fourth year of the AIM-Bio Program concludes, the AIM-Bio project management team has created a set of dashboards to highlight key metrics for both the research and lifelong learning programs. These dashboards provide an overview of the program status at a glance and summarize the key accomplishments. Data captured in the dashboards and a summary of the metrics are described below.
Lifelong learning activities and outcomes dashboards
Three AIM-Bio lifelong learning dashboards have been developed — one for the DTU program, one for the NC State program, and one for the two programs combined. These dashboards highlight the following metrics:
- Number of in-person courses delivered
- Number of people trained:
- In-person
- Online
- Master’s students
- Course satisfaction
- LinkedIn metrics – Trends for # of Posts, # of Impressions and # of Followers
Metrics are updated on a quarterly basis, and the team reviews the information to determine if any changes or updates to the program are recommended. The dashboard format provides a way to share the accomplishments of the program with the team and identify opportunities for the future.
Research activities and outcomes dashboards
Four AIM-Bio research dashboards highlight the Cell Engineering group, the Process Analytical Technologies group, the Single Use Devices group, and the consolidated metrics for the entire research program. These dashboards display the following metrics:
- Completed and active international exchanges
- Thesis committee members and advisors
- Joint and single site publications
- Institutional relationships
- Further funding
- Engagements
- Patents and trademarks
The dashboards are updated regularly, and the relevant data is also entered into Researchfish.com, a tool used by the Novo Nordisk Foundation to assess project success. The AIM-Bio team can access the latest metrics anytime on the AIM-Bio website. Please contact AIM-Bio Program Manager Delia Bradley for more information.
